Abstract
The study analyzed the gut microbiota composition from over 3600 ambulatory donor samples undergoing routine medical evaluation from the USA, Canada, UK, Denmark, Australia, New Zealand, and other regions, spanning ages from 2 to over 70 years using the GA-map® multiplex polymerase chain reaction assay. The research aimed to identify differences in dysbiosis index (DI) score, diversity, and gastrointestinal (GI) microbiota across age categories and regions. Bacterial DNA was extracted, followed by amplification, hybridization, and detection of target organisms. The DI score showed an inverse but nonsignificant change with age. Significantly reduced DI scores were observed in adult cohorts from the UK and Denmark compared to North America and Australia, likely due to reduced bacterial diversity. Nonsignificant reduction in bacterial diversity was observed in ages over 70 years. Bacterial species such as Actinobacteria, Bifidobacterium spp., Dialister invisus and Megasphaera micronuciformis, and Streptococcus salivarius spp. were more abundant in younger cohorts. Older donors showed increased abundance of Proteobacteria. In European and Australian cohorts, lower levels of Bacteroides spp. and Prevotella spp. were detected relative to the US among other differences. This study demonstrated significant age- and region-specific differences in gut microbiota composition in an ambulatory population free from GI pathogens, inflammation typically associated with irritable bowel syndrome or inflammatory bowel disease, or active diarrhea.
Introduction
The microbial community of the human gastrointestinal (GI) tract (microbiota) is composed of a significant number of different microorganisms including bacterial, fungal, and viral species.1 These populations have been shown to interact with their human host and play an important role in health and disease. They have been associated with obesity, inflammatory bowel disease (IBD), irritable bowel syndrome (IBS), diabetes, and others.2–7 The development of this complex community begins at or before birth and appears to develop and stabilize along with the host. This maturation is likely affected by diet, genetics, and environmental exposures.8 The increasing understanding of the role of the microbiota in health and disease has prompted numerous studies to help identify the involved organisms and examine the role of these organisms and their bioactive products. In addition, there are ongoing efforts to develop better research and clinical tools along with therapeutic interventions that can affect clinical care.
The implications of gut microbiome dysbiosis on human health are profound. Dysbiosis is characterized by a reduction in microbial diversity, a loss of beneficial microorganisms, or an overgrowth of pathogenic species. This imbalance can result from a range of host-specific factors, including genetics, infections, and chronic inflammation.1 Lifestyle influences such as poor dietary patterns, alcohol, and exposure to xenobiotics such as antibiotics, pharmaceuticals, and food additives may play a role as well.1 A diminished presence of beneficial bacteria can compromise intestinal barrier integrity, leading to increased permeability and promoting systemic inflammation. Furthermore, proinflammatory diets can initiate or exacerbate dysbiosis, creating a self-perpetuating cycle that further disrupts microbial homeostasis.
The gut microbiome functions much like any ecological system, where greater diversity is typically associated with better health outcomes. Increased microbial diversity has been linked to enhanced longevity, stronger immune responses, extroverted behavior, improved insulin sensitivity, better outcomes in sepsis, more stable sleep patterns, reduced incidence of colic, and various other physiological and behavioral benefits. Research shows that microbial diversity is lowest during infancy, gradually increasing through adolescence and young adulthood, with a general decline observed in older populations.8 Early establishment of a diverse gut microbiota appears critical for proper immune maturation. Interestingly, while diversity is usually beneficial, it may be elevated in certain dysbiotic states, such as IBS and IBD. Overall, microbiome diversity plays a central role in maintaining systemic health.
An important diagnostic test to address these needs was reported by Casen and associates in 2015, GA-map® Dysbiosis Test (Genetic Analysis, AS, Oslo, Norway).9 Numerous clinical studies have used this system to study a variety of important medical conditions.1 Although most of these clinical studies are well controlled, they often included only a small number of participants focused on a specific clinical disease. In addition, there is a need to better understand microbiome variability in the ambulatory population, which includes changes with age, ethnicity, geography, and lifestyle.7 Doctor’s Data Inc. has been performing a GA-map® GI microbiota test developed by Genetic Analysis AS in conjunction with other stool biochemical markers and using these findings to assist clinicians with targeted health decisions supported by laboratory results. The current testing population encompasses pediatric, adult, and geriatric populations as well as samples from various regions such as North America, Western Europe, and Australia. An international dataset consisting of over 3600 patient samples across the age continuum has been used for this study, thus allowing the analysis of the effects of age and region on the microbiota of the GI tract.
Materials and Methods
Sample Collection, Preparation, and Exclusion Criteria
Stool samples were submitted by ambulatory outpatient donors during their routine medical evaluation. The use of de-identified microbiome results in this study was deemed secondary, not human subject research according to 45 CFR 46, (4 iii) and is considered exempt from IRB requirement. Samples for the GA-map® test were collected into Cary Blair media vials with a final 1:3 stool-to-media ratio. The same patient concurrently collected stool in an empty vial without preservative for other testing; fecal consistency was determined upon receipt from the vial without preservative. Sample donors were requested to abstain from antibiotics, antiparasitic and antifungal drugs, probiotic supplements, proton pump inhibitors, and Bismuth for 2 weeks before sample collection. Donors were requested to abstain from nonsteroidal antiinflammatory drugs, digestive enzymes, laxatives, activated charcoal, betaine HCl, antacids, and bentonite clay for 2 days before sample collection. Donors were asked not to collect samples when there is active bleeding from hemorrhoids or menstruation, to wait at least 4 weeks from colonoscopy or barium enema before collection, and not to contaminate the sample with urine or water during collection. Patients were requested to store GA-map®, and unpreserved stool vials refrigerated (for GA-map®) and frozen (for plain vials for stool consistency and other testing) if they were not able to ship immediately. All samples were tested immediately upon receipt in the laboratory; however, GA-map® test samples were stable at room temperature for up to 12 days or in refrigerated conditions for up to 14 days. Samples were rejected if they exceeded the stability limit from collection or received at ambient temperature. The following stool samples were excluded from final dataset: watery stool samples (consistent with diarrhea), samples with detectable inflammatory markers (>3 μg/g, >3 μg/g, and >500 μg/g stool for calprotectin (ALPCO), lactoferrin (IDK), and lysozyme (APLCO), respectively) or tested positive or inconclusive for GI pathogens [Adenovirus, Clostridium difficile toxin A/B, Campylobacter, Cryptosporidium, Escherichia coli, E. histolytica, ETEC, Giardia, Norovirus, Rotovirus A, Salmonella, Shigella, STEC, Vibrio cholerae (Luminex GPP)].
DNA Extraction
DNA and RNA from stool samples preserved in Cary Blair media were extracted using the Chemagic 360® system using the Perkin Elmer® stool pathogen kit (CMG-1216-MI04) in accordance with manufacturer instructions. Briefly, samples are lysed using lysis buffer and heat shock. Lysed samples were centrifuged, and the supernatant was loaded onto the extraction system. Nucleic acid from lysate was then purified using magnetic beads and magnetized rod-heads. Extracted DNA/RNA was eluted from magnetic beads and resuspended in the buffer for GA-map® testing.
GA-map® Assay, Dysbiosis Index, and Data Processing
Assay manufacturer instructions were followed for GA-map® Dysbiosis Test (Genetic Analysis, AS). Signal normalization and dysbiosis index (DI) score calculations have been previously described.9 Normalized signal (normalized median fluorescence intensity) from instrument output (Luminex™ 200™) was used to calculate median signal for each organism and age or country combination using DATAtab®.10 Percentage of total median signal (Table 4) for each organism was calculated by dividing median signal of an organism-age combination by the sum of total median signals of all organisms for the same age category using the Microsoft Excel®. Bacterial alpha diversity was calculated using the Shannon diversity index by the GA-map® Dysbiosis test software.
The microbiota analysis test used in this study identifies 48 bacterial targets across six phyla. The test utilizes an algorithm that was trained and validated using 48 bacterial markers’ signal intensity obtained from 625 adults, including healthy subjects (n=254), patients with IBS (n=236), and IBD (n=135). The GA-map® Dysbiosis Analyzer software algorithm calculates the degree of dysbiosis (DI) of a given sample. The test assigns each sample a DI ranging from 1 to 5. DI >2 indicates that the microbiota is divergent from a healthy reference population and thus reported as “dysbiotic,” while a score of 2 or lower is reported as “normobiotic” indicating a healthy bacterial microbiota with appropriate alpha diversity and abundance of bacterial species in the gut.
Quality Control
All testing, quality control, staff competency, and quality assurance practices followed assay manufacturer instructions and CLIA High Complexity Clinical Laboratory standards.
Demographics and Sample De-Identification
Patient age, sex, country of origin, stool consistency, GA-map® results were obtained from the Laboratory Information System. Sample IDs associated with results were deidentified and assigned a unique anonymized sample ID specifically for this study.
Statistical Analysis and Methods
The MS Excel® was used for demographic analysis, sex distribution (Tables 1 and 2), and correlation matrix calculations (Supplementary Data). DATAtab® was used to generate violin plots (Figures 1–3) and calculate descriptive statistics including median signal and statistical significance (nonparametric Kruskal–Wallis and two-way analysis of variance (ANOVA) tests with Dunn–Bonferroni post hoc test, adjusted P-value <0.05) among different ages (Table 3), countries of origin (Table 5), and sex (Supplementary Data). It was also used to test for normal distribution (Kolmogorov–Smirnov (with Lilliefors correction), Shapiro–Wilk, and Anderson–Darling tests, data available upon request).
Table 1: Regional and age distribution of study population.
| Cohort | 2–5 yo | 6–11 yo | 12–17 yo | Adult 18–70 yo | >70 yo | Total |
|---|---|---|---|---|---|---|
| USA | 47 | 87 | 65 | 1842 | 108 | 2149 |
| UK | 20 | 57 | 34 | 511 | 16 | 638 |
| Australia | 1 | 9 | 11 | 254 | 4 | 279 |
| Denmark | 4 | 7 | 3 | 164 | 2 | 180 |
| Canada | 4 | 6 | 4 | 106 | 3 | 123 |
| New Zealand | 0 | 0 | 3 | 42 | 2 | 47 |
| Others | 13 | 14 | 10 | 161 | 5 | 203 |
| Total | 89 | 180 | 130 | 3080 | 140 | 3619 |
Table 2: Percent (%) female across age and countries.
| Females (%) | 2–5 yo | 6–11 yo | 12–17 yo | Adult 18–70 yo | >70 yo | Avg. % |
|---|---|---|---|---|---|---|
| USA | 45% | 40% | 60% | 79% | 69% | 75% |
| UK | 40% | 39% | 44% | 76% | 94% | 70% |
| Australia | 0% | 33% | 55% | 72% | 75% | 70% |
| Denmark | 50% | 57% | 33% | 74% | 100% | 72% |
| Canada | 75% | 17% | 100% | 76% | 100% | 75% |
| New Zealand | N/A | N/A | 67% | 79% | 100% | 79% |
| Others | 23% | 36% | 50% | 73% | 60% | 66% |
| Avg. % | 42% | 39% | 55% | 77% | 73% | 73% |
Figure 1: DI score vs. age categories. DI, dysbiosis index.
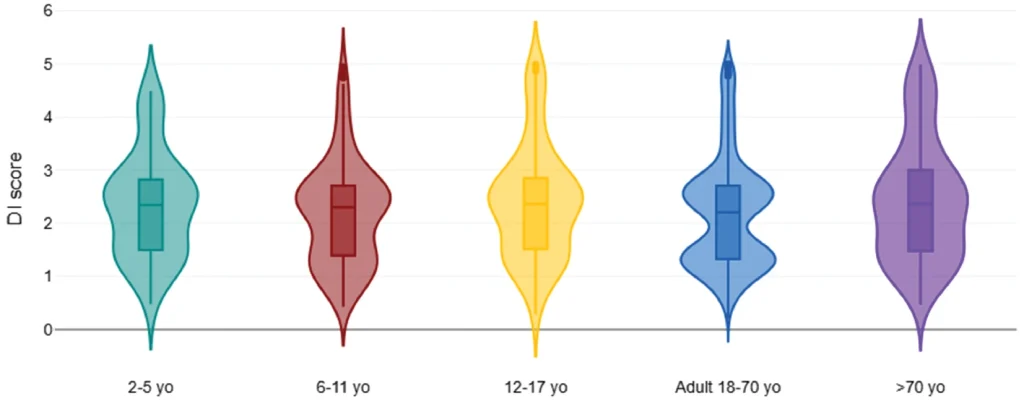
Figure 2: Diversity vs. age categories.
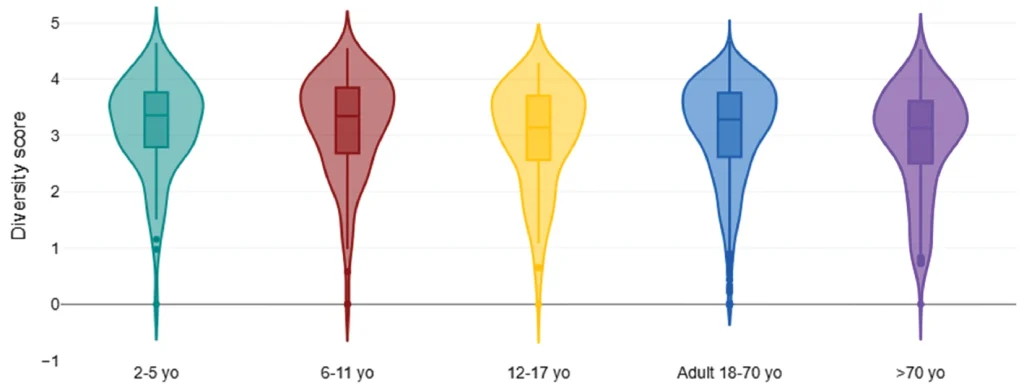
Figure 3: Adult (18–70 yo) DI score vs. country of origin. DI, dysbiosis index.
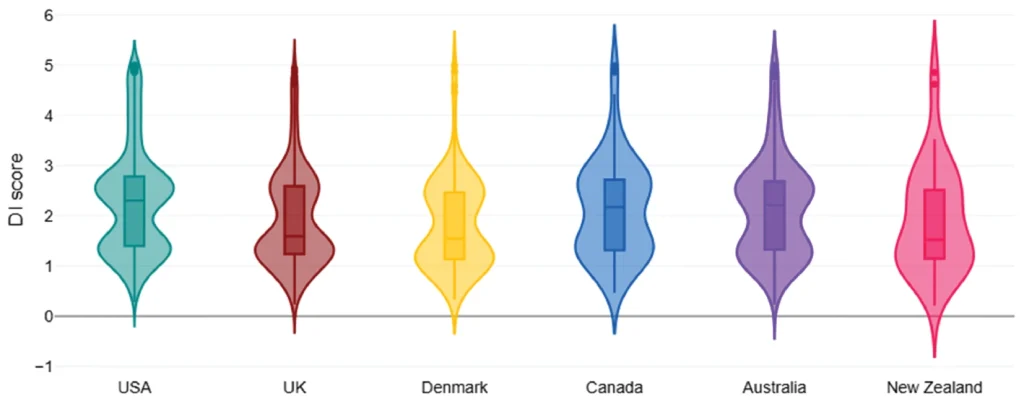
Table 3: DI score, diversity, and organism median signal by age category.
| Categories | 2–5 yo | 6–11 yo | 12–17 yo | Adult 18–70 yo | >70 yo |
|---|---|---|---|---|---|
| DI score | 2.3 | 2.3 | 2.4 | 2.2 | 2.4 |
| Diversity score | 3.4 | 3.4 | 3.1 | 3.3 | 3.1 |
| Acinetobacter junii | 0.9 | 1.0 | 1.1 | 0.9 | 1.0 |
| Actinobacteria | 54.1 | 47.1 | 24.5 | 7.0 | 1.8 |
| Actinomycetales | 6.1 | 7.2 | 7.4 | 7.5 | 7.4 |
| Alistipes | 104.2 | 181.3 | 210.1 | 186.8 | 147.9 |
| Bacteroides fragilis | 42.9 | 36.3 | 22.7 | 16.2 | 17.7 |
| Bacteroides pectinophilus | 2.4 | 3.5 | 3.2 | 3.9 | 4.1 |
| Bacteroides spp. | 65.1 | 55.6 | 53.9 | 33.9 | 28.7 |
| Bacteroides zoogleoformans | 8.4 | 13.5 | 18.6 | 20.1 | 17.5 |
| Bifidobacterium spp. | 35.6 | 31.5 | 22.2 | 13.5 | 11.0 |
| Dialister invisus | 101.6 | 79.4 | 62.9 | 28.5 | 27.1 |
| Dialister invisus & Megasphaera micronuciformis | 36.2 | 22.7 | 23.6 | 5.1 | 4.8 |
| Dorea spp. | 5.5 | 8.4 | 7.6 | 9.1 | 9.1 |
| Eubacterium rectale | 26.1 | 35.0 | 32.2 | 22.6 | 17.2 |
| Faecalibacterium prausnitzii | 216.4 | 234.7 | 242.3 | 200.5 | 134.3 |
| Parabacteroides johnsonii | 2.5 | 8.2 | 10.9 | 12.2 | 11.2 |
| Phascolarctobacterium sp. | 3.0 | 3.7 | 3.9 | 7.0 | 57.0 |
| Proteobacteria | 70.2 | 70.9 | 81.3 | 76.7 | 93.1 |
| Ruminococcus albus & R. bromii | 13.4 | 22.3 | 8.0 | 7.5 | 8.7 |
| Ruminococcus gnavus | 19.4 | 15.5 | 14.8 | 15.1 | 17.6 |
| Streptococcus salivarius spp. thermophilus | 6.9 | 3.9 | 3.9 | 3.1 | 4.8 |
| Veillonella spp. | 381.9 | 412.6 | 379.3 | 338.6 | 314.8 |
Organisms with significant differences from adults (P-value <0.05) in bold.
Organisms omitted due to no significant difference in signal from adults: Akkermansia muciniphila, Alistipes onderdonkii, Anaerobutyricum hallii, Bacilli, Bacteroides spp. & Prevotella spp., Bacteroides stercoris, Catenibacterium mitsuokai, Clostridia, Clostridium methylpentosum, Clostridium sp., Coprobacillus cateniformis, Enterobacteriaceae, Eubacterium siraeum, Firmicutes, Holdemanella biformis, Lachnospiraceae, Lactobacillus ruminis & Pediococcus acidilactici, Lactobacillus spp., Mycoplasma hominis, Parabacteroides spp., Shigella spp. & Escherichia spp., Streptococcus agalactiae & Eubacterium rectale, Streptococcus salivarius spp. thermophilus & S. sanguinis, Streptococcus spp.
Table 4: Organism percent (%) of total median signal by age category.
| Categories | 2–5 yo | 6–11 yo | 12–17 yo | Adult 18–70 yo | >70 yo |
|---|---|---|---|---|---|
| Veillonella spp. | 8.85% | 9.08% | 8.55% | 8.06% | 7.71% |
| Faecalibacterium prausnitzii | 5.02% | 5.17% | 5.46% | 4.78% | 3.29% |
| Alistipes | 2.42% | 3.99% | 4.74% | 4.45% | 3.62% |
| Proteobacteria | 1.63% | 1.56% | 1.83% | 1.83% | 2.28% |
| Bacteroides spp. | 1.51% | 1.22% | 1.22% | 0.81% | 0.70% |
| Dialister invisus | 2.35% | 1.75% | 1.42% | 0.68% | 0.66% |
| Eubacterium rectale | 0.61% | 0.77% | 0.73% | 0.54% | 0.42% |
| Bacteroides zoogleoformans | 0.19% | 0.30% | 0.42% | 0.48% | 0.43% |
| Bacteroides fragilis | 1.00% | 0.80% | 0.51% | 0.39% | 0.43% |
| Ruminococcus gnavus | 0.45% | 0.34% | 0.33% | 0.36% | 0.43% |
| Bifidobacterium spp. | 0.82% | 0.69% | 0.50% | 0.32% | 0.27% |
| Parabacteroides johnsonii | 0.06% | 0.18% | 0.25% | 0.29% | 0.27% |
| Dorea spp. | 0.13% | 0.18% | 0.17% | 0.22% | 0.22% |
| Actinomycetales | 0.14% | 0.16% | 0.17% | 0.18% | 0.18% |
| Ruminococcus albus & R. bromii | 0.31% | 0.49% | 0.18% | 0.18% | 0.21% |
| Actinobacteria | 1.25% | 1.04% | 0.55% | 0.17% | 0.04% |
| Phascolarctobacterium sp. | 0.07% | 0.08% | 0.09% | 0.17% | 1.40% |
| Dialister invisus & Megasphaera micronuciformis | 0.84% | 0.50% | 0.53% | 0.12% | 0.12% |
| Bacteroides pectinophilus | 0.05% | 0.08% | 0.07% | 0.09% | 0.10% |
| Streptococcus salivarius spp. thermophiles | 0.16% | 0.09% | 0.09% | 0.07% | 0.12% |
| Acinetobacter junii | 0.02% | 0.02% | 0.02% | 0.02% | 0.02% |
Organisms <0.5× or >2× the adult % of total median signal in bold.
Table 5: Adult (18–70 yo) DI score, diversity, and organism median signal by country of origin.
| Categories | USA | Canada | UK | Denmark | Australia | New Zealand |
|---|---|---|---|---|---|---|
| DI score | 2.3 | 2.2 | 1.6 | 1.6 | 2.2 | 1.5 |
| Diversity score | 3.2 | 3.4 | 3.4 | 3.5 | 3.2 | 3.3 |
| Actinobacteria | 5.4 | 9.3 | 12.2 | 8.8 | 11.5 | 3.9 |
| Actinomycetales | 6.9 | 8.2 | 9.5 | 10.5 | 8.6 | 10.3 |
| Bifidobacterium spp. | 12.7 | 13.6 | 16.0 | 14.8 | 15.4 | 12.0 |
| Bacteroides fragilis | 16.7 | 19.4 | 15.1 | 17.4 | 14.6 | 13.2 |
| Bacteroides pectinophilus | 3.7 | 5.3 | 4.9 | 4.7 | 3.6 | 5.0 |
| Bacteroides spp. | 41.3 | 30.2 | 25.2 | 23.2 | 27.1 | 17.0 |
| Bacteroides spp. & Prevotella spp. | 1275.2 | 1225.8 | 1213.3 | 1156.1 | 1201.2 | 1092.5 |
| Bacteroides stercoris | 35.5 | 34.8 | 30.0 | 32.4 | 33.1 | 24.6 |
| Parabacteroides spp. | 96.6 | 94.9 | 83.4 | 77.3 | 101.2 | 61.6 |
| Firmicutes | 608.4 | 676.8 | 687.1 | 687.0 | 584.1 | 682.5 |
| Bacilli | 74.8 | 79.1 | 83.2 | 99.9 | 91.5 | 107.3 |
| Clostridia | 277.7 | 269.4 | 288.4 | 309.9 | 300.6 | 294.4 |
| Clostridium methylpentosum | 6.3 | 4.9 | 5.8 | 6.2 | 6.2 | 5.3 |
| Dialister invisus & Megasphaera micronuciformis | 5.1 | 6.7 | 6.2 | 5.5 | 4.5 | 4.8 |
| Faecalibacterium prausnitzii | 196.8 | 183.9 | 211.5 | 238.5 | 212.8 | 232.7 |
| Lactobacillus spp. | 11.3 | 11.6 | 13.7 | 13.0 | 12.5 | 16.6 |
| Phascolarctobacterium sp. | 19.2 | 3.9 | 4.7 | 9.4 | 4.1 | 174.9 |
| Ruminococcus albus & R. bromii | 6.4 | 6.7 | 11.6 | 11.1 | 13.7 | 8.5 |
| Ruminococcus gnavus | 16.5 | 14.6 | 13.0 | 14.1 | 13.9 | 13.0 |
| Veillonella spp. | 324.4 | 352.9 | 376.2 | 370.7 | 340.5 | 327.4 |
| Mycoplasma hominis | 2.7 | 4.8 | 14.0 | 15.0 | 9.1 | 13.2 |
Organisms with significant differences from USA (P-value <0.05) in bold.
Organisms omitted due to no significant difference in signal from the USA: Alistipes, Alistipes onderdonkii, Bacteroides zoogleoformans, Parabacteroides johnsonii, Catenibacterium mitsuokai, Clostridium sp., Coprobacillus cateniformis, Dialister invisus, Dorea spp., Holdemanella biformis, Anaerobutyricum hallii, Eubacterium rectale, Eubacterium siraeum, Lachnospiraceae, Lactobacillus ruminis & Pediococcus acidilactici, Streptococcus agalactiae & Eubacterium rectale, Streptococcus salivarius spp. thermophilus & S. sanguinis, Streptococcus salivarius spp. thermophilus, Streptococcus spp., Proteobacteria, Acinetobacter junii, Enterobacteriaceae, Shigella spp. & Escherichia spp., Akkermansia muciniphila.
RStudio PerMANOVA (vegan package, adonis2, method=‘bray’) was used to calculate the significance (P-value) and % effect size (R2*100) of age, sex, and stool consistency on overall results (Table 6).
Table 6: Age, sex, and stool consistency significance and effect size.
| Factor | P-value, % effect size |
|---|---|
| Age | 0.001, 0.6% |
| Sex | 0.001, 0.2% |
| Stool consistency (if watery) | 0.001, 0.8% |
PerMANOVA (vegan package, adonis2, method=‘bray’).
Results
Cohort
A retrospective analysis of a cohort of 3623 (7126 before exclusion criteria) patients contained a total of 3220 adult [>18 years old (yo)] and 403 pediatric (<18 yo) samples, with 181 female and 222 male pediatric samples. Regional and percent female distributions are shown in Tables 1 and 2, respectively. Age categories of <12 yo are slightly overrepresented by males, while categories >12 yo and older consist of a majority of female samples. Adult female samples (18–70 yo) represent the majority of the cohort, while the 2–5 and >70 yo cohorts are represented by the lowest number of samples. All age cohorts have the highest representation from samples from the USA, followed by the United Kingdom, and then Australia. Relatively minor contributions to North American, European, and Australian regions are from samples from Canada, Denmark, and New Zealand, respectively. Samples submitted from other countries represent an overall minor contribution to the overall cohort, with the highest contribution of 161 samples to the adult age category.
Changes with Age
The median DI score and distribution appeared stable from ages 2 to 70 yo with only a slight increase with age >70 years (Figure 1A).
There were observed differences in diversity, specific bacterial marker signal, and its proportion of the total signal composition with pediatric and >70 yo cohorts (Figure 2, Tables 3 and 4). Bacterial diversity appeared slightly reduced (albeit without significance) for >70 yo cohorts compared to adults.
Several organisms represented the most predominant gut colonizers across all age categories. These are Bacteroides spp. & Prevotella spp., Lachnospiraceae, Firmicutes, Veillonella spp., Clostridia, Faecalibacterium prausnitzii, with Bacteroides spp. & Prevotella spp. being the most abundant. Additional organisms demonstrating notable changes across age categories are discussed below.
Actinobacteria
Results show a significant decrease in the Actinobacteria phylum with age (Table 3). Our data show that Actinobacteria is most abundant in 2–5 yo age group, representing 1.25% of the total median signal of all measured organisms vs. 0.2% for adults (Table 4) and continues to decrease through lifetime.
Actinomycetales Order
Results show that, unlike the Actinobacteria phylum it belongs to, the number of organisms in the order Actinomycetales does not show statistically significant increases with age (Table 3), despite slightly lower results in the 2–5 age group. The relative percentage of the total median signal remains similar throughout all ages (approximately 0.17%, Table 4).
Bifidobacterium
This organism shows a significant decline with age (Table 3).
Lactobacillus spp.
Our study results show that Lactobacillus spp. remains mostly consistent across one’s lifetime as a percentage of measured organisms (Table 4), without showing significant change through age (Table 3).
Faecalibacterium prausnitzii
Results show that F. prausnitzii is abundant across age categories, ranging from 3.9% to 5.6%. F. prausnitzii shows an increase in the 6–11 age group and an apparent decrease after the age of 17, as well as shows a significant reduction with advanced age >70 (Table 3).
Ruminococcus gnavus
Ruminococcus gnavus was most abundant in those <6 years of age, and then declined in those more than 6, and remained mostly consistent throughout the rest of one’s lifetime (Table 3).
Proteobacteria
Proteobacteria is unique in that it is most abundant at the beginning and the end of life, with a statistically significant increase for the greater-than-70 cohort (Table 3).
Akkermansia muciniphila
In this study, A. muciniphila showed apparent highest values in those >70 years of age, and apparent lowest in those aged 2–5 years (albeit without statistical significance).
Other notable organisms showing higher apparent abundance in the 2–5 years of age and early in life include B. fragilis, Bacteroides spp., Dialister invisus & Megasphaera micronuciformis, and Streptococcus salivarius spp. thermophilus.
Notable increase in the >70 yo cohort vs. adults was seen for Proteobacteria, S. salivarius spp. thermophilus. The median signal of Phascolarctobacterium spp. was notably different from adults but was not statistically significant (Table 3).
Changes Among Regions
The DI score was significantly lower in the European region (median 1.6; Table 5, Figure 2) when compared to the USA, Canada, and Australia (median 2.3; Table 5, Figure 2). The median DI score was the same within North American, European cohorts, and Australian regions. The lower apparent DI score for New Zealand may have been influenced by a smaller cohort size (n=42, Table 2). The diversity score was significantly higher in the European cohort vs. North America and Australia (Table 5) and showed an inverse correlation to DI score (correlation coefficient −0.65; Supplementary Data).
R. gnavus was noted to be highest in the USA cohorts, followed by Canada, Denmark, Australia, and lowest in the United Kingdom and New Zealand cohorts. It too was positively correlated to the DI score (0.26; Supplementary Data).
Proteobacteria was highest in the Australian cohort (albeit nonsignificantly).
Lower levels of Bacteroides spp., Bacteroides spp. & Prevotella spp., Bacteroides stercoris were observed in European and Australian regions. Lastly, both European and Australian cohorts showed higher Mycoplasma hominis relative to North America, and this organism was inversely correlated to the DI score (−0.22; Supplementary Data).
Discussion
Alpha Diversity vs. Beta Diversity
Alpha diversity measures the diversity within a single sample or community, focusing on species richness and evenness.11 It yields insight into how diverse a given microbial environment is, as per the individual. Conversely, beta diversity assesses the differences in microbial composition between different samples or groups. While alpha diversity differences are displayed in Tables 3 and 5 (as diversity score), different ages and countries of origin did not show notable beta diversity differences based on the Bray–Curtis dissimilarity index and principle coordinate analysis (XLStat, data not shown). This may be partly due to relative stability of high abundance organisms (i.e., Bacteroides spp. and Prevotella spp., Table 4) and considerable abundance variability within each group (see Limitations section).
Species–Species Interaction Networks
Within the gut microbiome, species–species interaction networks include a range of interactions, such as neutralism, commensalism, amensalism, direct interference, competition, interspecies transfer, quorum sensing, and exploitation.12 These relationships are often facilitated by the exchange of nutrients such as amino acids, short-chain fatty acids, and vitamins. These interactions are vital for the complex dynamics of the gut microbiome and their vast impact on host health. However, predicting these interactions based on co-occurrence patterns is challenging due to the nuanced nature of the gut microbiome and limitations of assessment, including in vivo vs. in vitro observations.13
Gut microbial networks display a degree of interindividual variability, as well as homogeneity among regions and age groups.14 This variability highlights the importance of considering geographic and demographic factors regarding gut microbiome composition and interaction networks. Network analysis can reveal key bacterial genera associated with various diseases, such as IBD and IBS, that may be attributed to interactions within the gut microbiome.
Dysbiosis
Dysbiosis is characterized by a reduction in microbial diversity, a loss of beneficial microorganisms, or an overgrowth of pathogenic species. Gut microbiota dysbiosis has been associated with IBS, IBD, obesity, diabetes, and depression and has potential implications regarding the bidirectional communication pathway with the central nervous system and end-organ systems.1,3,9
The DI score appeared consistent for those above the age of 2 with a slight, nonsignificant increase in >70 yo. The apparent decrease in the DI score in >70 yo appears to be influenced by lower abundance of F. prausnitzii (DI score correlation coefficient −0.44; Supplementary Data) and higher Proteobacteria in this population. Specific organisms and overall abundance did indicate significant differences among age categories (Table 3).
Statistically significant differences in specific organisms, yet comparable DI scores for ages 2–70 can partly be explained by calculation used to generate a DI score. DI score was developed to differentiate the IBS population from healthy adult population9 and derived from log-normal distribution by assigning estimated portions of the distribution to different values on a scale set from 0 to 5. Individual organism differences influence overall DI score with variable effect, but no single organism determines the overall DI score calculation.
Preliminary results prior to the application of the exclusion criteria showed the there is a unique dysbiosis signature for ages 0–2 (with a significant increase in the DI score and in Actinobacteria, Bifidobacterium spp., D. invisus & M. micronuciformis, Enterobacteriaceae, Proteobacteria, R. gnavus, Shigella spp. & Escherichia spp., S. salivarius spp. thermophilus, Veillonella spp., and a significant reduction was also observed in Alistipes, Anaerobutyricum hallii, Bacteroides petinophilus, Dorea spp., Parabacteroides spp., Phascolarctobacterium spp. compared to adults; data not shown). The authors chose to exclude this age cohort (n=31) from the final analysis due to a higher prevalence of detectable inflammatory markers, calprotectin and lactoferrin, and challenges in ruling out pathologic GI inflammation in <2 yo using these markers. We have previously demonstrated associations between inflammatory markers, calprotectin, lactoferrin, and lysozyme, and increased Escherichia and Proteobacteria microbiome abundance. Since the microbiome in this age group is of significant interest, its full characterization and elucidation of its relationship with inflammatory markers will be a focus of future studies. Unique early-age microbiome does seem plausible as primary bacterial colonizers of the infant gut microbiota initiate key processes to facilitate the composition of the gut microbiota across one’s lifetime. The first few years of life display a distinctive gut microbiota and a significant timeframe with implications for the nervous, immunological, and developmental systems during one’s lifetime. The gut microbiota’s primary colonizers influence the successive organisms and establish community composition.
Given the profound impact of early microbial colonization, future research is essential to elucidate the nuances of normobiotic gut microbiome maturation during the first two years of life. Advancing our understanding in this area will enhance understanding of human physiology and the potential for therapeutic approaches to support health in infancy and beyond. Ongoing studies will undoubtedly refine clinical insights, reinforcing the necessity of integrating gut microbiome assessments and implications into broader healthcare frameworks.
Diversity
Our results found microbiota diversity to be lowest in older age (>70) and adolescence (12–17) without statistical significance. Failure to demonstrate significance may have been influenced by the small sample size. Previous studies have shown the lowest diversity in infancy, with increasing levels throughout adolescence and young adulthood.8,15,16 The early establishment of a diverse gut microbiota may be crucial for proper immune maturation.8
Studies have been mixed regarding gut microbiota diversity in elderly populations. A review study found that gut microbiota diversity levels remain stable across adulthood but then increase in elderly age.15 Other studies have found that gut microbiota diversity decreases in elderly populations, even more so in centenarians.8,17–19 Our results show that gut microbiota diversity only appears lower, although sample size can also be limiting. Key considerations related to the gut microbiota and advanced age that warrant further exploration include comorbidities, “inflammaging,” muscle mass, cognition, and metabolism homeostasis.
Age
Studies have shown that Bifidobacterium spp., Bacteroides, and Clostridium species constitute primary colonizers of the infant gut microbiota.8,20 The gut microbiota is like any ecosystem, in that the initial organisms influence subsequent development. The establishment of primary gut bacteria, aka primary colonizers, during initial colonization stages affects the gut’s glycan composition, promoting bacterial adaptation throughout one’s lifetime.21 Maternal phenotype influences human milk oligosaccharides (HMOs), which in turn have been shown to modify gut microbiota composition in infants.22
While previous studies have shown a decrease in anaerobic bacteria such as Bifidobacterium spp. and an increase in Clostridium in those aged 70 and above,22 our results only showed similar findings for Bifidobacterium spp.
Results from this study are consistent with those from the current research in that Bifidobacterium spp. are abundant at an early age, yet additional data have been identified in this population. Actinobacteria, D. invisus, and S. salivarius spp. thermophilus represented high relative percentages of the total median signal in the 2–5 yo cohort (Table 4). F. prausnitzii was noted to have apparent lower abundance in that age category (Supplementary Data), albeit without showing statistical significance compared to adults (Table 3).
Actinobacteria
As one of the largest bacterial phyla, there are many genera and species with diverse characteristics and functions within the Actinobacteria phylum.23 Corynebacterium, Actinomyces, Mycobacterium, Streptomyces, and Bifidobacterium are within the Actinobacteria phylum. High correlation between Bifidobacterium spp. and Actinobacteria phylum was observed in this study (Supplementary Data). These spore-forming filamentous bacteria may be aerobic or anaerobic and are found in aquatic as well as terrestrial habitats, responsible for the characteristically earthy odor in soil due to the production of geosmin.24 As a diverse phylum, Actinobacteria confers numerous secondary metabolites, responsible for approximately two-thirds of naturally derived antibiotics, as well as anticancer, anthelmintic, and antifungal compounds.23,24
Actinomycetales Order
Differences observed in this study between Actinobacteria phylum and Actinomycetales order demonstrate the importance of considering bacteria within the gut microbiota by phyla, order, and species. Most Actinomycetes are Gram-positive, filamentous, partially acid-fast, branched bacteria.25
Bifidobacterium
Bifidobacterium is well known to dominate gut microbial communities throughout the first year of life.21,26 A study by Taft et al. showed that infant Bifidobacterium populations and subspecies vary based on geographical patterns of breastfeeding.27 Although breastfeeding data were not available in our population, it is likely that breastfeeding patterns in countries in this study are similar. Secondly, the exclusion of detectable fecal lactoferrin results and the <2 yo cohort likely exclude most samples from breastfed babies in this study due to the assay’s cross-reactivity with lactoferrin originating from breast milk.
Bifidobacterium is a genus composed of at least 54 different species.27 Bifidobacterium comprises a significant portion of the human gut microbiota and plays a role in the fermentation of nondigestible carbohydrates and influences the host’s immune system. Bifidobacterium is responsible for the breakdown of carbohydrates, producing short-chain fatty acids (SCFAs) lactate and acetate.21 Gut microbes that consume HMOs predominate the infant’s gut. Bifidobacterium is no exception, specifically, B. infantis thrives on HMOs and confers antiinflammatory benefits in premature intestinal cells and decreases intestinal permeability.28 Bifidobacterium species possess an enzyme called lacto-N-biosidase, which enables them to assimilate galactooligosaccharides, a primary component of breast milk, and produce SCFAs that confer antiinflammatory properties.22 Bifidobacterium is a common probiotic and may confer the production of immunoglobulins, folic acid synthesis, the assimilation of dietary substrates, and the production of potential anti-carcinogenic activity and bacteriocins.21
Lactobacillus spp.
Our study did not find significant differences in Lactobacillus spp. among ages (Table 3); however, it was higher in the European and Australian cohorts (Table 4). Moderate correlation was observed with Holdemanella biformis (coefficient of 0.5; Supplementary Data). Other studies have shown that Lactobacillus prevalence significantly increases with age in North America and Europe but decreases with age in non-Western societies.29
Lactobacillus spp. is among the most researched gut bacteria and continually proves itself to be influential over the GI tract and host physiology. Lactobacillus, a rod-shaped, Gram-positive, non-spore-forming, facultative anaerobic bacterium from the phylum Firmicutes, metabolizes carbohydrates to produce lactic acid.30 Dietary polyphenols, such as pomegranate, chocolate, and grapeseed, as well as soluble fiber, serve as substrates for Lactobacillus spp.
The beneficial metabolites lactic acid, SCFAs, vitamins B and K, hydrogen peroxide, exopolysaccharides, gamma-aminobutyric acid, conjugated linoleic acid, and bacteriocins are produced by Lactobacillus.30 These metabolites influence fecal secretory IgA production, luminal pH, mucosal barrier integrity, and host homeostasis. Lactobacillus spp. enhances the intestinal barrier and protects against pathogens by interacting with the immune system through microorganism-associated molecular patterns.30 Furthermore, Lactobacillus cells release cytokines that affect the immune response, reduce inflammation, and mitigate oxidative stress.30
Faecalibacterium prausnitzii
Our results are consistent with previous studies that show that F. prausnitzii decreases with advanced age.15,31 Our data also indicate a notable increase for ages 6–11 compared to adults (Table 3).
F. prausnitzii is the most abundant butyrate producing bacteria in a healthy gut microbiome and a biomarker of gut health.31 F. prausnitzii supports intestinal mucosal barrier integrity and exerts antiinflammatory effects via antiinflammatory metabolites, including butyrate, peptides, and an extracellular polymeric matrix.31 F. prausnitzii has been observed to be associated with major depressive disorder, Parkinson’s disease (PD), bipolar disorder, IBS, IBD, diabetes mellitus (DM), colorectal cancer and dermatitis.32
F. prausnitzii has been reported to vary by geography, notably reduced diversity of clades in Western populations, yet conversely associated with geographical diets high in soluble fiber intake, such as Mediterranean.31 Increased F. prausnitzii were observed for Denmark cohort in this study (Table 3). In addition, moderate correlations were observed with Clostridium methylpentosum (correlation coefficient 0.55; Supplementary Data) and Lachnospiraceae (correlation coefficient 0.45; Supplementary Data). The significant role of F. prausnitzii in the gut microbiome may be a link between westernized diets, which are characterized by low soluble fiber intake, and the inflammatory pathogenesis of noncommunicable chronic diseases (NCCD). While this phenomenon is multifactorial, the gut microbiome and F prausnitzii may plausibly contribute.
Ruminococcus gnavus
In this study, R. gnavus represented a significant increase for the 2–5 yo cohort (Table 3). Previous studies have shown that R. gnavus has a high prevalence from early life, and one study suggested that levels in the infant’s gut occur at levels as high as Bifidobacterium spp., yet there may be a difference based on breastfeeding.33
R. gnavus, a common constituent of the human gut microbiota, is a Gram-positive anaerobic bacterium belonging to the phylum Firmicutes, owing its name to the Latin adjective gna’vus (na’vus) referring to the active fermentation capability of this bacterium.33 R. gnavus possesses the capacity to degrade mucin glycans, deconstruct and metabolize complex glycans, and produce bacteriocins, tryptamine, SCFAs, and secondary bile acids.33 Of note, although R. gnavus is frequently classified as a key “mucus-degrading bacteria” in the gut, there exists no evidence in the literature to indicate that it degrades mucus to a degree that would compromise the gut barrier.33
R. gnavus interacts with mucin and plays a role in mucosal barrier integrity and has been associated with metabolic-associated liver dysfunction [MALD, previously known as nonalcoholic fatty liver disease (NAFLD)], IBD, obesity, and DM.33,34 Studies have shown R. gnavus to be associated with systemic lupus erythematosus, atopic dermatitis, pediatric allergies, migraines, anxiety, depression, epilepsy, Alzheimer’s disease, and attention-deficit/hyperactivity disorders.33
Previous studies have shown that R. gnavus has a high prevalence from early life, and one study suggested that levels in the infant’s gut occur at levels as high as Bifidobacterium spp., yet there may be a difference based on breastfeeding.33 R. gnavus may influence the priming of infant gut microbiome, implicating a healthy weight status.33 Existing evidence indicates that the relative abundance of R. gnavus increases post-weaning, while the relative abundance of Bifidobacterium species decreases.33 Studies have shown that R. gnavus persists throughout adulthood and may decrease in the elderly; yet, enrichment in elderly populations may be associated with neurocognitive disorders.33
Proteobacteria
Our study found that Proteobacteria was highest in those >70 yo. While the median signal of Proteobacteria in ages 6–11 was similar to ages 2–5, neither of these was significantly different from adults.
Bacteria such as E. coli, Salmonella, Shigella, V. cholera, Rickettsia, Bordetella, and Helicobacter pylori belong to the Proteobacteria phylum.19 Moderate correlation was observed with Shigella spp. and Escherichia spp. (coefficient 0.72; Supplementary Data). Many additional bacteria reside within this phylum and may be associated with inflammation, cardiovascular diseases, IBD, IBS, obesity, DM, MALD (formerly NAFLD), nonalcoholic steatohepatitis, and dysbiosis.19 An increased relative abundance of Proteobacteria is often cited in the literature as dysbiosis.19
Proteobacteria maintain high heterogeneity among bacteria in this phylum. As the largest phylum within the bacteria domain, Proteobacteria are Gram-negative.19 Although not all diseases begin in the gut, the link between low-grade inflammation, driven by lipopolysaccharides (LPS), and the onset of metabolic disorders is well established.19
Akkermansia muciniphila
This study shows a nonsignificant increase with age (Table 3).
Other studies have also shown A. muciniphila to be relatively more abundant with advanced age.15 A. muciniphila’s role in glucose metabolism, insulin sensitivity, lipid homeostasis, and mucosal barrier integrity may be increasingly valuable in advanced age. In a murine model, A. muciniphila protected against Alzheimer’s disease.35 Future studies are warranted to explore the potential associations between A. muciniphila abundance and advanced age.
A. muciniphila literally translates to mucus lover and is recognized for its ability to degrade mucus. A. muciniphila has been associated with satiety, gastric emptying, glucose homeostasis, insulin sensitivity, and a reduction in body weight as well as hepatic and systemic inflammation.35 A. muciniphila plays a pivotal role in appetite and energy homeostasis via the gut-derived peptide, glucagon-like peptide-1 (GLP-1), a major focus of current glycemic control therapeutics.
As A. muciniphila degrades mucin, it releases fewer complex carbohydrates from the mucin layer and generates organic acids, such as acetate and propionate.36 A. muciniphila plays a role regarding intestinal permeability and inflammation, which has been implicated not only in GI conditions but also in systemic conditions such as autoimmunity and cardiovascular diseases.37 Decreased levels of A. muciniphila have been associated with diabetes, obesity, and IBD, indicating a protective role against intestinal inflammation.36
Conversely, elevated levels of A. muciniphila have been found in PD, multiple sclerosis (MS), and colorectal cancer.38 While multiple studies have denoted elevated A. muciniphila in individuals diagnosed with PD and MS, results have been mixed regarding colorectal cancer and levels of this bacterium.38 Elevated A. muciniphila may be a compensatory beneficial response in the MS microbiome.39 Yet the potential exists that greater A. muciniphila populations will decrease the mucin layer as evidenced by a murine model.16 In theory, elevated A. muciniphila could deplete the mucin layer and lead to increased intestinal permeability. This mechanism of action may be associated with the findings of elevated A. muciniphila in individuals diagnosed with PD and MS.
A. muciniphila is known to consume polyphenols, particularly those with high amounts of proanthocyanidins, such as cranberry and pomegranate.40 A. muciniphila induces various anti- and proinflammatory cytokines, aimed at obesity, insulin homeostasis and inflammation in visceral adipose tissue. It also increases GLP-1 production.36
Geography
Geography provides many common environmental factors to influence gut microbial ecology via vertical transmission. Proximity strongly influences the gut microbiome as numerous common environmental exposures influence gut microbial ecology. Previous studies have shown that genetically unrelated but cohabiting families exhibited a significantly more similar microbiome to each other than to members of different families.26 Despite biological mothers being uniquely situated to transmit an initial inoculum of microbes to their infants, evidence has shown that the fecal microbiome of mothers was no more like their children’s than that of fathers.26
Geography and the associated dietary habits are known to significantly influence the gut microbiome in the first year of life.20 Geographical location influences the composition of the microbiota, owning to host genetics, diet, antibiotic trends, hygiene, environment, and lifestyle. Studies have revealed that European infants show a geographical gradient in their microbiota: Northern European infants have more Bifidobacterium spp., Clostridium spp., and Atopobium spp., while Southern European infants have more Eubacteria, Lactobacillus, and Bacteroides species.12 Despite diverse European diets, the trend toward a westernized diet (high fat, low fiber) is associated with an increase in NCCD, such as obesity and cardiovascular diseases, across the continent.21
To date, few published studies exist comparing gut microbiota data across geography and age. Our study included geographical regions from largely westernized populations, with a very few individuals from Asia and Africa (represented as “Others” in Table 1). The data collected from regions of westernized origin permit the analysis of geographical nuances across a relatively homogenous diet.
Limitations
Despite stringent sample preparation and collection criteria instructions, it is possible that some samples were collected with deviations from the procedure (including antibiotic or probiotic use) as the samples were self-collected without the supervision of a physician or healthcare professional. Donor medical and surgical history, medication use, and dietary preferences were not available for the cohort. It is anticipated, however, that the probability of an entire age or country cohort being on the same medication, diet, or supplement and having the same effect on median DI score, abundance, or organism abundance is low. To further mitigate the influence of possible nonhealthy donors included in the dataset, the median organism signal was used in Tables 3, 4, and 5, which is less influenced by outlier effects than the mean. While aggregate changes in microbiota vs. age and regions are available, no longitudinal or outcome data about the cohort are available, preventing disease correlation to observed microbiota differences. The adult cohort is predominantly composed of middle-aged women, mostly from the USA. A cohort consisting of more samples at age extremes as well as more males may have shown different trends. In addition, while most cohorts include >100 donors, it is possible that smaller cohorts do not fully represent the typical microbiota for the overall age category or region due to higher prevalence of certain diseases, medications, or other factors in these study cohorts vs. the overall population. This is relevant to age extremes that were represented by a relatively small number of samples, mostly from the USA. Additional studies would be required to confirm the observed microbiome differences for the current cohort in this study.
Supplementary Data generally show poor to nonexistent correlation between age, DI score, diversity, and individual organism median signal results. This is likely influenced by high signal variability within a cohort. Prior to application of the exclusion criteria, a two-way ANOVA was used to determine if significant differences exist among males and females in the same age category (Supplementary Data). There were two organisms showing significant sex differences for the 6–11 yo category and three organisms for the >70 yo category. While 14 organisms showed statistically significant differences between adult males and females, these differences were not evident in any other age categories. The majority of organism signal differences between adult males and females were minor when compared to the overall trend across age categories such as the decline of F. prausnitzii for both males and females with increasing age. PerMANOVA analysis was used to determine the effect of age, sex, and stool consistency on overall microbiome results prior to application of exclusion criteria. It was determined that these factors have an effect size of <1% on the microbiome. The effect was shown to be statistically significant (P-value <0.05) but represents an overall minor contribution to the total variability observed (Table 6). To that point, there is considerable variability within the age and country of origin categories with significant microbiome data overlap as discussed in the alpha vs. beta diversity section. The Kruskal–Wallis test with Dunn–Bonferroni post hoc analysis was chosen due to all of the data being nonparametric (data not shown but available upon request). The technology employed in this study is a semi-quantitative; yet, it is a reproducible and standardized approach for long-term microbiome analysis based on our experience.
Strengths
Despite limitations, this study also has notable strengths including a large, multinational cohort and robust exclusion of GI pathogen, inflammation typically associated with IBS and IBD, or active diarrhea presence in the cohort. In addition, all testing was performed at a single laboratory utilizing the same methodology that was proven to compare well to the assay manufacturer’s method via extensive validation studies. These factors minimized the effect of method-to-method and laboratory-to-laboratory variability and allowed the identification of true differences in the DI score as well as organisms across ages and regions. The study also contained easy-to-follow collection instructions and extensive information for sample donor preparation as well as sample exclusion criteria. The samples were received and analyzed within their stability windows, minimizing the effect of various sample storage conditions on overall results. While the overall cohort is overrepresented by middle-aged women from the USA, this population is quite relevant for the development of newborn microbiota.41
Conclusion
There exists a plethora of research linking clinical outcomes to immune function, metabolic disorders, neurodegenerative diseases, mood disorders, and enteropathogens to the gut microbiota.1 Dysbiosis in adulthood has been associated with numerous adverse clinical outcomes, including but not limited to IBD, metabolic disorders, and neurodegenerative diseases. While these observational studies have contributed greatly to scientific consensus, there remains a need for a model to study variations in the gut microbiota and their associated clinical outcomes. Defining a normobiotic gut microbiota via diversity and dysbiosis is the first step in this direction. Results here identify gut microbial dysbiosis and diversity across age and geography in a large well-characterized cohort.
While previous studies have compared westernized microbiomes to non-westernized microbiomes,22 ours is among the first to evaluate the westernized microbiota via diversity, dysbiosis, and bacterial constituents across age categories. Studies have compared microbiota across varied diets; yet, our study evaluates the intrinsic gut microbiota of all individuals, regardless of diet. This study provides baseline microbiota data that may be employed in future research.
The gut microbiota composition is well known to shift toward an adult-like configuration within the first 3 years.22,26 Our results generally support these findings. Our results are consistent with the scientific consensus that at 3 years of age, a child’s gut microbiota composition and diversity generally resemble those of adults.22
Evaluating gut microbiota biomarkers from a large international dataset allows for a standardized model to investigate the complex interplay between the gut microbiota, host homeostasis, and clinical outcomes. The data here demonstrate that gut microbiota dysbiosis and diversity apply across age and geography. It also demonstrates a higher DI score in North American and Australian cohorts relative to Europeans, which is unrelated to GI pathogens, inflammation typically associated with IBS or IBD, or active diarrhea. This is driven in part by reduced diversity. Underlying factors responsible for diversity differences and other potential contributors to regional DI score difference, such as R. gnavus and M. hominis abundance, require further research. These biomarkers may be employed in the application of targeted clinical decisions supported by laboratory results. Future research is needed to elucidate unique microbiota variations and subsequent implications for microbiota-based interventions in clinical practice.
Conflicts of Interest
Valentinas Gruzdys, PhD, serves as Consultant to Doctor’s Data, and collaborates with Joel Mortensen, PhD, Assistant Medical Director in Microbiology at Doctor’s Data, in relation to microbiology lab development. Julia Malkowski, ND, DC, BSc, is a Staff Doctor in the Clinical Education Department at Doctor’s Data.
Data Availability Statement
Raw data were generated at Doctor’s Data Inc. Derived data supporting the findings of this study are available from the corresponding author (J.M.) on request.
References
- Bidell MR, Hobbs ALV, Lodise TP. Gut microbiome health and dysbiosis: a clinical primer. Pharmacotherapy. 2022;42(11):849–57. https://doi.org/10.1002/phar.2731.
- Gravdal K, Kirste KH, Grzelak K, et al. Exploring the gut microbiota in patients with pre-diabetes and treatment naïve diabetes type 2—a pilot study. BMC Endocr Disord. 2023;23(1):179. https://doi.org/10.1186/s12902-023-01432-0.
- Vatn S, Carstens A, Kristoffersen AB, et al. Faecal microbiota signatures of IBD and their relation to diagnosis, disease phenotype, inflammation, treatment escalation and anti-TNF response in a European Multicentre Study (IBD-Character). Scand J Gastroenterol. 2020;55(10):1146–56. https://doi.org/10.1080/00365521.2020.1803396.
- El-Salhy M, Winkel R, Casen C, et al. Efficacy of fecal microbiota transplantation for patients with irritable bowel syndrome at 3 years after transplantation. Gastroenterology. 2022;163:982–94.e14. https://doi.org/10.1053/j.gastro.2022.06.020.
- Telle-Hansen VH, Gaundal L, Bastani N, et al. Replacing saturated fatty acids with polyunsaturated fatty acids increases the abundance of Lachnospiraceae and is associated with reduced total cholesterol levels-a randomized controlled trial in healthy individuals. Lipids Health Dis. 2022;21(1):92. https://doi.org/10.1186/s12944-022-01702-1.
- Gaundal L, Myhrstad MCW, Rud I, et al. Gut microbiota is associated with dietary intake and metabolic markers in healthy individuals. Food Nutr Res. 2022;66. https://doi.org/10.29219/fnr.v66.8580.
- Shanahan F, Ghosh TS, O’Toole PW. The healthy microbiome—what is the definition of a healthy gut microbiome? Gastroenterology. 2021;160(2):483–94. https://doi.org/10.1053/j.gastro.2020.09.057.
- Rodríguez JM, Murphy K, Stanton C, et al. The composition of the gut microbiota throughout life, with an emphasis on early life. Microb Ecol Health Dis. 2015;26:26050. https://doi.org/10.3402/mehd.v26.26050.
- Casén C, Vebø HC, Sekelja M, et al. Deviations in human gut microbiota: a novel diagnostic test for determining dysbiosis in patients with IBS or IBD. Aliment Pharmacol Ther. 2015;42:71–83. https://doi.org/10.1111/apt.13236.
- DATAtab. T-test, chi-square, ANOVA, regression, correlation. https://datatab.net/.
- Hagerty SL, Hutchison KE, Lowry CA, Bryan AD. An empirically derived method for measuring human gut microbiome alpha diversity: demonstrated utility in predicting health-related outcomes among a human clinical sample. PLoS One. 2020;15(3):e0229204. https://doi.org/10.1371/journal.pone.0229204.
- Champion C, Momal R, Le Chatelier E, et al. OneNet-One network to rule them all: consensus network inference from microbiome data. PLoS Comput Biol. 2024;20(12):e1012627. https://doi.org/10.1371/journal.pcbi.1012627.
- Berry D, Widder S. Deciphering microbial interactions and detecting keystone species with co-occurrence networks. Front Microbiol. 2014;5:219. https://doi.org/10.3389/fmicb.2014.00219.
- Yadav D, Ghosh TS, Mande SS. Global investigation of composition and interaction networks in gut microbiomes of individuals belonging to diverse geographies and age-groups. Gut Pathog. 2016;8:17. https://doi.org/10.1186/s13099-016-0099-z.
- Badal VD, Vaccariello ED, Murray ER, et al. The gut microbiome, aging, and longevity: a systematic review. Nutrients. 2020;12(12):3759. https://doi.org/10.3390/nu12123759.
- Qu S, Zheng Y, Huang Y, et al. Excessive consumption of mucin by over-colonized Akkermansia muciniphila promotes intestinal barrier damage during malignant intestinal environment. Front Microbiol. 2023;14:1111911. https://doi.org/10.3389/fmicb.2023.1111911.
- Deng F, Li Y, Zhao J. The gut microbiome of healthy long-living people. Aging (Albany NY). 2019;11(2):289–90. https://doi.org/10.18632/aging.101771.
- Wang N, Li R, Lin H, et al. Enriched taxa were found among the gut microbiota of centenarians in East China. PLoS One. 2019;14(10):e0222763. https://doi.org/10.1371/journal.pone.0222763.
- Rizzatti G, Lopetuso LR, Gibiino G, et al. Proteobacteria: a common factor in human diseases. Biomed Res Int. 2017;2017:9351507. https://doi.org/10.1155/2017/9351507.
- Ouyang R, Ding J, Huang Y, et al. Maturation of the gut metabolome during the first year of life in humans. Gut Microbes. 2023;15(1):2231596. https://doi.org/10.1080/19490976.2023.2231596.
- Wilson AS, Koller KR, Ramaboli MC, et al. Diet and the human gut microbiome: an international review. Dig Dis Sci. 2020;65(3):723–40. https://doi.org/10.1007/s10620-020-06112-w.
- Rinninella E, Raoul P, Cintoni M, et al. What is the healthy gut microbiota composition? A changing ecosystem across age, environment, diet, and diseases. Microorganisms. 2019;7(1):14. https://doi.org/10.3390/microorganisms7010014.
- Barka EA, Vatsa P, Sanchez L, et al. Taxonomy, physiology, and natural products of actinobacteria. Microbiol Mol Biol Rev. 2016;80:1–43. https://doi.org/10.1128/mmbr.00019-15.
- Salwan R, Sharma V. Molecular and biotechnological aspects of secondary metabolites in actinobacteria. Microbiol Res. 2020;231:126374. https://doi.org/10.1016/j.micres.2019.126374.
- McNeil MM, Brown JM. The medically important aerobic actinomycetes: epidemiology and microbiology. Clin Microbiol Rev. 1994;7(3):357–417. https://doi.org/10.1128/CMR.7.3.357.
- Yatsunenko T, Rey FE, Manary MJ, et al. Human gut microbiome viewed across age and geography. Nature. 2012;486(7402):222–7. https://doi.org/10.1038/nature11053.
- Taft DH, Lewis ZT, Nguyen N, et al. Bifidobacterium species colonization in infancy: a global cross-sectional comparison by population history of breastfeeding. Nutrients. 2022;14(7):1423. https://doi.org/10.3390/nu14071423.
- Underwood MA, German JB, Lebrilla CB, Mills DA. Bifidobacterium longum subspecies infantis: champion colonizer of the infant gut. Pediatr Res. 2015;77(1–2):229–35. https://doi.org/10.1038/pr.2014.156.
- Ghosh TS, Arnoux J, O’Toole PW. Metagenomic analysis reveals distinct patterns of gut lactobacillus prevalence, abundance, and geographical variation in health and disease. Gut Microbes. 2020;12(1):1–19. https://doi.org/10.1080/19490976.2020.1822729.
- Dempsey E, Corr SC. Lactobacillus spp. for gastrointestinal health: current and future perspectives. Front Immunol. 2022;13:840245. https://doi.org/10.3389/fimmu.2022.840245.
- De Filippis F, Pasolli E, Ercolini D. Newly explored Faecalibacterium diversity is connected to age, lifestyle, geography, and disease. Curr Biol. 2020;30(24):4932–43.e4. https://doi.org/10.1016/j.cub.2020.09.063.
- Martín R, Rios-Covian D, Huillet E, et al. Faecalibacterium: a bacterial genus with promising human health applications. FEMS Microbiol Rev. 2023;47(4):fuad039. https://doi.org/10.1093/femsre/fuad039.
- Crost EH, Coletto E, Bell A, Juge N. Ruminococcus gnavus: friend or foe for human health. FEMS Microbiol Rev. 2023;47(2):fuad014. https://doi.org/10.1093/femsre/fuad014.
- Hong J, Fu T, Liu W, et al. An update on the role and potential molecules in relation to Ruminococcus gnavus in inflammatory bowel disease, obesity and diabetes mellitus. Diabetes Metab Syndr Obes. 2024;17:1235–48. https://doi.org/10.2147/DMSO.S456173.
- Ou Z, Deng L, Lu Z, et al. Protective effects of Akkermansia muciniphila on cognitive deficits and amyloid pathology in a mouse model of Alzheimer’s disease. Nutr Diabetes. 2020;10:12. https://doi.org/10.1038/s41387-020-0115-8.
- Si J, Kang H, You HJ, Ko G. Revisiting the role of Akkermansia muciniphila as a therapeutic bacterium. Gut Microbes. 2022;14(1):2078619. https://doi.org/10.1080/19490976.2022.2078619.
- Novakovic M, Rout A, Kingsley T, et al. Role of gut microbiota in cardiovascular diseases. World J Cardiol. 2020;12(4):110–2. https://doi.org/10.4330/wjc.v12.i4.110.
- Pellegrino A, Coppola G, Santopaolo F, et al. Role of Akkermansia in human diseases: from causation to therapeutic properties. Nutrients. 2023;15(8):1815. https://doi.org/10.3390/nu15081815.
- Cox LM, Maghzi AH, Liu S, et al. Gut microbiome in progressive multiple sclerosis. Ann Neurol. 2021;89(6):1195–11. https://doi.org/10.1002/ana.26084.
- Anhê FF, Pilon G, Roy D, et al. Triggering Akkermansia with dietary polyphenols: a new weapon to combat the metabolic syndrome? [published correction appears in https://doi.org/10.1136/gutjnl-2014-307142]. Gut Microbes. 2016;7(2):146–53. https://doi.org/10.1080/19490976.2016.1142036.
- Tian M, Li Q, Zheng T, et al. Maternal microbe-specific modulation of the offspring microbiome and development during pregnancy and lactation. Gut Microbes. 2023;15(1):2206505. https://doi.org/10.1080/19490976.2023.2206505.
Supplementary Data
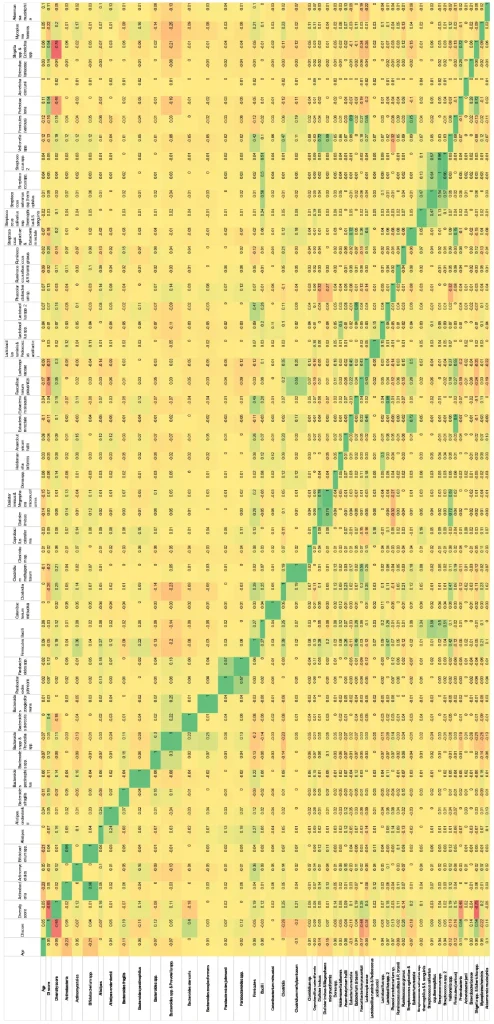
Organism correlation matrix (green=direct correlation; red=inverse correlation; stool consistency, inflammatory marker and GI pathogen exclusion criteria not applied; n=7126).
Sex differences in pediatric males and females.
| Organism | Group 1 | Group 2 | Mean difference | Standard error (SE) | T | P value |
|---|---|---|---|---|---|---|
| Actinobacteria | 6–11 yo – M | 6–11 yo – F | −34.64 | 10.225 | −3.39 | 0.046 |
| Bifidobacterium spp. | 6–11 yo – M | 6–11 yo – F | −25.73 | 6.754 | −3.81 | 0.009 |
Sex differences in adult (18–70 yo) males and females.
| Organism | Group 1 | Group 2 | Mean difference | Standard error (SE) | T | P value |
|---|---|---|---|---|---|---|
| Actinomycetales | Adult 18–70 yo – F | Adult 18–70 yo – M | 2.64 | 0.767 | 3.44 | 0.038 |
| Alistipes onderdonkii | Adult 18–70 yo – F | Adult 18–70 yo – M | 12.92 | 2.857 | 4.52 | <.001 |
| Bacteroides spp. & Prevotella spp. | Adult 18–70 yo – F | Adult 18–70 yo – M | −33.57 | 7.481 | −4.49 | <.001 |
| Bacteroides zoogleoformans | Adult 18–70 yo – F | Adult 18–70 yo – M | 6.44 | 1.721 | 3.74 | 0.012 |
| Firmicutes | Adult 18–70 yo – F | Adult 18–70 yo – M | 36.04 | 8.449 | 4.27 | 0.001 |
| Catenibacterium mitsuokai | Adult 18–70 yo – F | Adult 18–70 yo – M | −6.04 | 1.224 | −4.93 | <.001 |
| Holdemanella biformis | Adult 18–70 yo – F | Adult 18–70 yo – M | −6.57 | 0.913 | −7.19 | <.001 |
| Anaerobutyricum hallii | Adult 18–70 yo – F | Adult 18–70 yo – M | 7.05 | 1.384 | 5.09 | <.001 |
| Eubacterium rectale | Adult 18–70 yo – F | Adult 18–70 yo – M | −16.44 | 3.146 | −5.23 | <.001 |
| Faecalibacterium prausnitzii | Adult 18–70 yo – F | Adult 18–70 yo – M | −15.61 | 4.38 | −3.56 | 0.024 |
| Lachnospiraceae | Adult 18–70 yo – F | Adult 18–70 yo – M | −32.92 | 6.641 | −4.96 | <.001 |
| Lactobacillus spp. | Adult 18–70 yo – F | Adult 18–70 yo – M | −7.44 | 1.754 | −4.24 | 0.001 |
| Akkermansia muciniphila | Adult 18–70 yo – F | Adult 18–70 yo – M | 24.26 | 3.604 | 6.73 | <.001 |
Sex differences in >70 yo males and females.
| Organism | Group 1 | Group 2 | Mean difference | Standard error (SE) | T | P value |
|---|---|---|---|---|---|---|
| Streptococcus spp. | >70 yo – M | >70 yo – F | 5.56 | 1.544 | 3.6 | 0.021 |
| Proteobacteria | >70 yo – M | >70 yo – F | 122.25 | 26.712 | 4.58 | <.001 |
| Shigella spp. & Echerichia spp. | >70 yo – M | >70 yo – F | 93.33 | 25.106 | 3.72 | 0.013 |
No significant difference (P value >0.05) was observed between males and females for age groups 2–5 yo, 6–11 yo, 12–17 yo, adult 18–70 yo, and >70 yo for DI score, diversity score or any other organisms not listed above (see Table 3 for a full list).